

Website Contact:
Email Web Manager

National Stream & Aquatic Ecology Center
FOIA
Accessibility Statement
Non-Discrimination Statement
Information Quality
USDA Press Releases
USA.gov
Biological and
Physical Resources
Updated: 11/22/2021
Tools
 Wood Jam Dynamics, WooDDAM (2018-3)
Wood jams in stream corridors play an essential role in shaping valley bottoms. The Wood Jam Dynamics Database and Assessment Model (WooDDAM), a machine-learning multiple logistic regression statistical model for predicting wood jam dynamics during high flows, has been developed to improve understanding and management of both natural and anthropogenic wood jams in streams and floodplains.
WooDDAM is a collaborative data gathering effort for managers and researchers that is intended to build a database and predictive model of natural and anthropogenic wood jam dynamics. The database includes information about wood jam characteristics, channel and valley bottom morphology, hydrologic regime, and how wood jams change during high flows of varying magnitude. Many wood jams are tracked over multiple years, providing temporal change data. This database feeds a statistical model to predict how wood jams change during high flows, which can be used for deciding whether to reintroduce or retain wood jams in streams. Users of this predictive model can easily resurvey wood jams utilizing our field measurement protocol and are encouraged to submit resurvey data to contribute to the database and improve the model.
 The model is available for use and contributions at the Colorado State University WooDDAM website, which hosts the database, model, and instructions for using the tool.
 Stream Channel Flow Resistance Coefficient Computation Tool (2018-2)
A spreadsheet tool is available to assist practitioners with selecting flow resistance coefficients (Manning’s n, Darcy-Weisbach f) for stream channels. Generally, resistance is due to roughness induced by bed and bank grain material, bedforms (such as dunes and step pools), streambank and cross section variability, sinuosity, vegetation, large instream wood, and other obstructions. Coefficients are needed to quantify roughness for hydraulic modeling, stream assessments, stream restoration design, geomorphic analyses, and ecological studies.
Flow resistance coefficient estimation is approximate, requiring redundancy for confidence. This tool helps provide this redundancy, for more reliable flow resistance estimation. Nine quantitative methods, including Bathurst (1985) and Limerinos (1970), are provided and are automatically computed where relevant. The Arcement and Schneider (1989) method is also provided, which highlights resistance contributions from a variety of sources, including channel variability, obstructions, vegetation, and sinuosity.
- Spreadsheet Package (54.6MB)
- Spreadsheet Tool Only (0.2MB)
 Wildcat5 for Windows, A Rainfall-Runoff Hydrograph Model: User Manual and Documentation (2016-1)
Wildcat5 is an interactive Windows Excel®-based software package designed to assist watershed specialists in analyzing rainfall runoff events to predict peak flow and runoff volumes generated by single-event rainstorms for a variety of watershed soil and vegetation conditions. The model is intended for small catchments responsive to conditions of upland soils and cover. Its peak flow estimation techniques are appropriate for projects such as gully control, culvert sizing and forest roads, environmental impact analyses, and post-wildfire hydrologic response. The user manual provides step-by-step instructions for using the software and is organized in the same logical fashion in which the data are entered when using the program. Model inputs are rainstorm characteristics, parameters related to watershed soil and cover, runoff timing parameters, and unit hydrograph shape and scale selections. Many choices are available for each of the input categories and guidance is provided for their appropriate selection. Additionally, the user manual describes the fundamental concepts, capabilities, limitations, features, input requirements, and output of Wildcat5.
 Computational Design Tool for Evaluating the Stability of Large Wood Structures (2016-1)
Large logs are often placed in streams to benefit aquatic and riparian-dependent fish and wildlife as a part of stream restoration projects. When specifying the type of large wood structure to be used, restoration practitioners, planners, and local residents need to be assured that the constructed structures will likely remain in place under the expected conditions. To be considered stable, a structure must be able to resist hydraulic forces with an appropriate factor of safety. The design practitioner is typically forced to perform numerous complex and time-consuming calculations to achieve the desired level of safety, resulting in additional project time and expense. To assist these practitioners, an Excel spreadsheet tool was developed that applies computational equations and design guidelines to analyze virtually any proposed configuration of small-to-medium size structures.
- Spreadsheet Tool, version 1.2 (.xlsm, 1.01MB)
- Report, TN-103.2 (.pdf, 1.3MB)
- Single Log Design Example (.xlsm, 1.1MB)
- Multiple Log Design Example (.xlsm, 2.4MB)
- Validation Calculations (.pdf, 226KB)
 logPearson Frequency Analysis Spreadsheet for Analyses of Streamgage Records (2015-2, version 3.1)
Engineering projects along stream corridors require flow frequency estimates for their designs. Where sufficient streamgage data are available, the likely best method for developing flow frequency relationships are from statistical analyses of streamgage data. The standard procedure for developing these estimates use the logPearson frequency analysis, as detailed in Bulletin 17B (Interagency Advisory Committee on Water Data 1982). This spreadsheet tool was developed to implement the analysis procedures detailed in Bulletin 17B.
 FishXing: Software and Learning Systems for Fish Passage Through Culvert (2012-11)
Pronounced "Fish Crossing", this software is intended to assist engineers, hydrologists, and fish biologists in the evaluation and design of culverts for fish passage. FishXing 3 is a unique software tool for the assessment and design of culverts for fish passage. FishXing models the complexities of culvert hydraulics and fish performance for a variety of species and crossing configurations. The model has proven useful in identifying culverts that impede fish passage, leading to the removal of numerous barriers. As a design tool, FishXing accommodates the iterative process of designing a new culvert to provide passage for fish and other aquatic species.
FishXing Version 3 (13.6MB) 11/08/12
 BAGS: Bedload Assessment in Gravel-bedded Streams (2009-5)
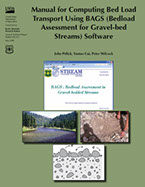
BAGS is a spreadsheet-based program that predicts bed load transport using six well-known bed load transport equations developed specifically for gravel-bed rivers. Sediment transport estimates are calculated on the basis of field measurements of channel geometry, reach-average slope, and bed material grain size. Field data and other relevant input parameters are entered into the program sequentially through a series of prompts to the user. Calculations are carried out using Visual Basic for Applications and the output is stored on individual spreadsheets.
Frequently Asked Questions for BAGS
User's Manual
Pitlick, John; Cui, Yantao; Wilcock, Peter. 2009. Manual for computing bed load transport using BAGS (Bedload Assessment for Gravel-bed Streams) Software. Gen. Tech. Rep. RMRS-GTR-223. Fort Collins, CO: U.S. Department of Agriculture, Forest Service, Rocky Mountain Research Station. 45 p.
The user manual provides step-by-step instructions for operating BAGS along with explanations of the rationale behind individual steps or model calculations. In addition to the step-by-step instructions, the BAGS manual describes in detail the individual bed load transport equations used in the BAGS model, provides guidance on interpreting the results from the model output, discusses possible strategies for evaluating the reasonableness of model results, and presents several examples from different studies illustrating how and why bed load modeling results can differ from field measurements.
Sediment Transfer Primer
Wilcock, Peter; Pitlick, John; Cui, Yantao. 2009. Sediment transport primer: estimating bed-material transport in gravel-bed rivers. Gen. Tech. Rep. RMRS-GTR-226. Fort Collins, CO: U.S. Department of Agriculture, Forest Service, Rocky Mountain Research Station. 78 p. (PDF File Size: 1.44 MB).
This document provides background information on sediment transport dynamics and is a supplement to BAGS so that the user can more effectively apply the model and interpret the bed load transport estimates. Additionally, the document provides information to help the user of BAGS define relevant and proper sediment transport problems, select appropriate model input data, interpret and apply the model output results in a useful and reliable fashion, and examine sources of error.
 Size-Class Pebble Count Analyzer (2007-9)
John Potyondy and Kristin Bunte
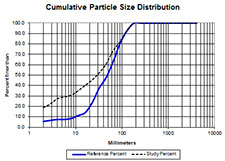
This Excel spreadsheet was developed to assist with the analysis of pebble count data tallied by size class. The spreadsheet helps users estimate sample size, enter field data tallied by size class, produce tables and graphs, and perform statistical analysis using contingency tables and the Pearson chi-squared statistic. After downloading, to execute the spreadsheet users must select "Enable Macros" for the spreadsheet to function properly.
 WinXSPRO: A Channel Cross-Section Analyzer (2005-1)
WinXSPRO is an interactive Windows™ software package designed to analyze stream channel cross section data for geometric, hydraulic, and sediment transport parameters. WinXSPRO was specifically developed for use in high-gradient streams (gradient > 0.01) and supports four alternative resistance equations for computing boundary roughness and resistance to flow. Cross section input data may be from standard cross section surveys using a rod and level or sag-tape procedures.
64-bit WinXSPRO software (right-click then "Save target as..." and save to your desktop, then install)
FAQ (Coming Soon!)