

National Insect & Disease Risk and Hazard Mapping

FHAAST has completed the 2013 - 2027 National Insect and Disease Risk Map (2012 NIDRM); a nationwide strategic assessment and database of the potential hazard for tree mortality due to major forest insects and diseases. The goal of NIDRM is to summarize landscape-level patterns of potential insect and disease activity, consistent with the philosophy that science-based, transparent methods should be used to allocate pest-management resources across geographic regions and individual pest distributions. In other words: prioritize investment for areas where both hazard is significant and effective treatment can be efficiently implemented.
NIDRM data can be used to:
Identify the potential impacts of pests and pathogens to forest ecosystems throughout the US for the 2013 - 2027 timeframe.
Generate forest pest and pathogen risk maps at a scale useful for resource planning and management purposes in many of our National Forests, National Parks, and other local units.
Develop an effective strategic planning tool that can inform assessments of natural ecosystems and ensure resources for forest pest prevention, suppression, and restoration reaches the highest priority areas.
Detect areas where hazardous fuels treatments coincide with lands at risk for forest pest activity, much of which is density driven. Efficiencies will be gained by prioritizing coincident areas.
For a quick overview of the 2013 – 2027 assessment and to learn more information on the differences between the 2006 and 2012 NIDRMs download the executive summary (PDF, 2 MB).
Explore forests vulnerable to attack from major insects and diseases by viewing the Interactive Story Map of the National Insect and Disease Risk Map.
2018 Updates

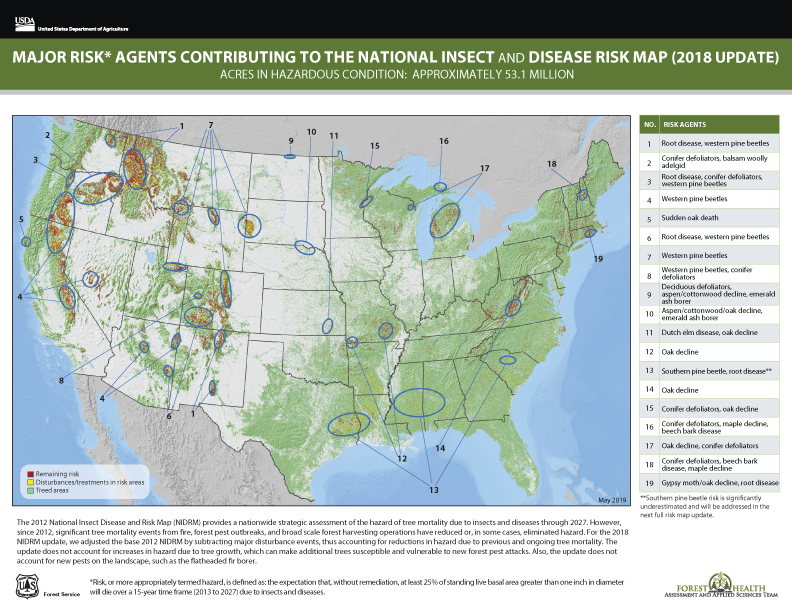
Major Risk Agents contributing to the 2018 National Insect and Disease Risk Map
Since 2012, significant tree mortality events from fire, forest pest outbreaks, and broad scale forest harvesting operations have reduced or in some cases eliminated hazard. For the 2018 NIDRM update, we adjusted the composite 2012 NIDRM by subtracting major disturbance events, thus accounting for reductions in hazard due to previous and ongoing tree mortality. The update does not account for increases in hazard due to tree growth, which can make additional trees susceptible and vulnerable to new forest pest attacks. Also, the update does not account for new pests on the landscape such as the Flathead fir borer, a wood boring beetle that primarily attacks stressed or weakened Douglas-fir, true firs, and western larch in Region 6.
The 2018 NIDRM update was generated by removing areas at risk if they experienced significant mortality according to data from the USDA Forest Service, Forest Health Protection (Insect and Disease Survey database); and the University of Maryland (Dr. Matt Hansen - Global Forest Change dataset).
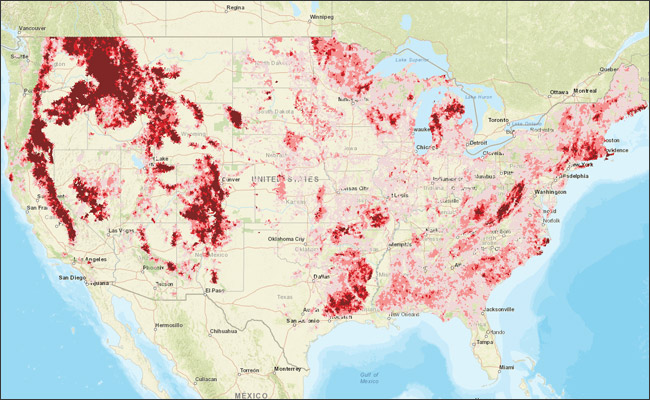
NIDRM WITH AREAS OF INTEREST (2018 UPDATE)
| NIDRM 2018 POSTERS AND PLACEMATS (COMPOSITE MAPS) |
|---|
| Conterminous U.S. with Areas of Interest Poster (2' x 3') (PDF, 26 MB) |
| Alaska & Hawaii with Areas of Interest Poster (2' x 3') (PDF, 16 MB) |
| Conterminous U.S. with Areas of Interest (8.5" x 11") (PDF, 8 MB) |
| Alaska & Hawaii with Areas of Interest (8.5" x 11") (PDF, 4 MB) |
| Conterminous U.S. Poster (2' x 3') (PDF, 2 MB) |
| Alaska and Hawaii Poster (2' x 3') (PDF, 17.5 MB) |
| Conterminous U.S. (8.5" x 11") (PDF, 3.1 MB) |
| Alaska and Hawaii (8.5" x 11") (PDF, 3.8 MB) |
GIS Data Downloads
Downloadable Zip files for each state include:
GIS raster data (Geotiff format)
Metadata for raster (MS Excel format)
Tabular summaries by county (MS Excel format)
| STATE |
|---|
| Conterminous U.S. GIS Data (10 MB ZIP) |
|
2012 National Insect & Disease Forest Risk Assessment Report
| NIDRM 2012 REPORT FILES |
|---|
| Executive Summary (2 MB PDF) |
| Full Report (Print Ready) (51 MB PDF) |
| Full Report (Spread) (51 MB PDF) |
| Report-Only (Spread) (18 MB PDF) |
| Atlas-only (Spread) (36 MB PDF) |
| NIDRM 2012 POSTERS AND PLACEMATS |
| Composite Map Poster (2' x 3') (10.5 MB PDF) |
| Subwatersheds Map Poster (2' x 3') (10.8 MB PDF) |
| Composite Map (8.5" x 11") (3.1 MB PDF) |
| Subwatersheds Map (8.5" x 11") (3.8 MB PDF) |
| KEY REFERENCES |
| NIDRM 2006 Report (20 MB PDF) |
| Multi-Criteria Framework for Producing Local, Regional, and National Insect and Disease Risk Maps (978 KB PDF) |
GIS Data for the 2012 National Insect & Disease Risk Map Report
Data includes:
Zip files with downloadable GIS raster data (ArcINFO GRID format)
Information on how to access NIDRM map and image services
Downloadable tabular summaries (MS Excel format)
Within each zip file* is an ArcINFO workspace that includes the relevant raster data (GRID format), a README file that explains the file naming conventions, and layer files for default symbolization. Each raster dataset includes embedded metadata. The Data Dictionary describes these datasets.
*Please keep your web browser window open and allow extra time when downloading large zip files.
| CONTIGUOUS US | PREVIEW |
|---|---|
| Hazard by agent-Eastern pests (ZIP) | .XLS File 32 KB |
| Hazard by agent-Western pests (ZIP) | .XLS File 32 KB |
| Hazard by agent - Pests that span L48 (ZIP) | .XLS File 32 KB |
| Composite hazard from all pests (ZIP) | .XLS File 13 KB |
| Hazard by host tree species (ZIP) | .XLS File 36 KB |
| Treed area, Total basal area (ZIP) | .XLS File 13 KB |
| ALASKA | PREVIEW |
| All NIDRM GIS raster datasets (ZIP) | .XLS File 50 KB |
| HAWAII | PREVIEW |
| All NIDRM GIS raster datasets (ZIP) | .XLS File 25 KB |
Map Services
National Insect and Disease Risk Map Viewer
Map services provide web layers with fixed symbology that are convenient for map display but not usable for geo-processing. NIDRM hazard by agent map services can be added to your GIS maps by making an ArcGIS server connection to https://apps.fs.usda.gov/fsgisx05/rest/services and navigating to the NIDRM_Map folder. These map services can also be browsed from the NIDRM web map viewer. In that same server connection the ‘Hosts’ folder contains a comprehensive set of tree species map services including those used to build NIDRM models.
These map services are combined with tables, graphics and text in the Forest Health Advisory System (FHAS). Use this web map application to explore forest health hazards in places of interest such as National Forests and Parks, Tribal Lands, and more.
Tabular Data Downloads
186 individual forest pest : individual tree species host models were created by forest health experts to build the 2013- 2027 NIDRM outputs. For details on how each of these 186 models were parameterized please download the 2013-2027 NIDRM Model Details workbook.
Excel workbooks that summarize NIDRM 2013 – 2027 outputs by National Forests and National Parks: National Forest Summaries and National Park Summaries
Watershed Summaries
The following downloads are ArcGIS 10.1 file geodatabases that summarize NIDRM 2013-2027 outputs by 6th level (12-digit) Hydrologic Unit Code (HUC) watersheds. The geodatabase tables summarize composite hazard, as well as breakouts by individual insect or disease and by host tree species that can be joined to the included 6th level HUC watershed polygons Note: This summary is based on a 2010 version of the 6th level HUC watershed dataset and tables will not properly join to more recent 6th level HUC versions.
| CONTIGUOUS US | PREVIEW |
|---|---|
| Geodatabase with HUC 12 polygons (ZIP) | .XLSX File 55 KB |
| ALASKA | PREVIEW (Excel Files) |
| Geodatabase with HUC 12 polygons (ZIP) | .XLSX File 54 KB |
| HAWAII | PREVIEW (Excel Files) |
| Geodatabase with HUC 12 polygons (ZIP) | .XLSX File 32 KB |
| CONTIGUOUS US & ALASKA | PREVIEW (Excel Files) |
| NFS Subwatersheds (Excel File) | .XLSX File 14 KB |