
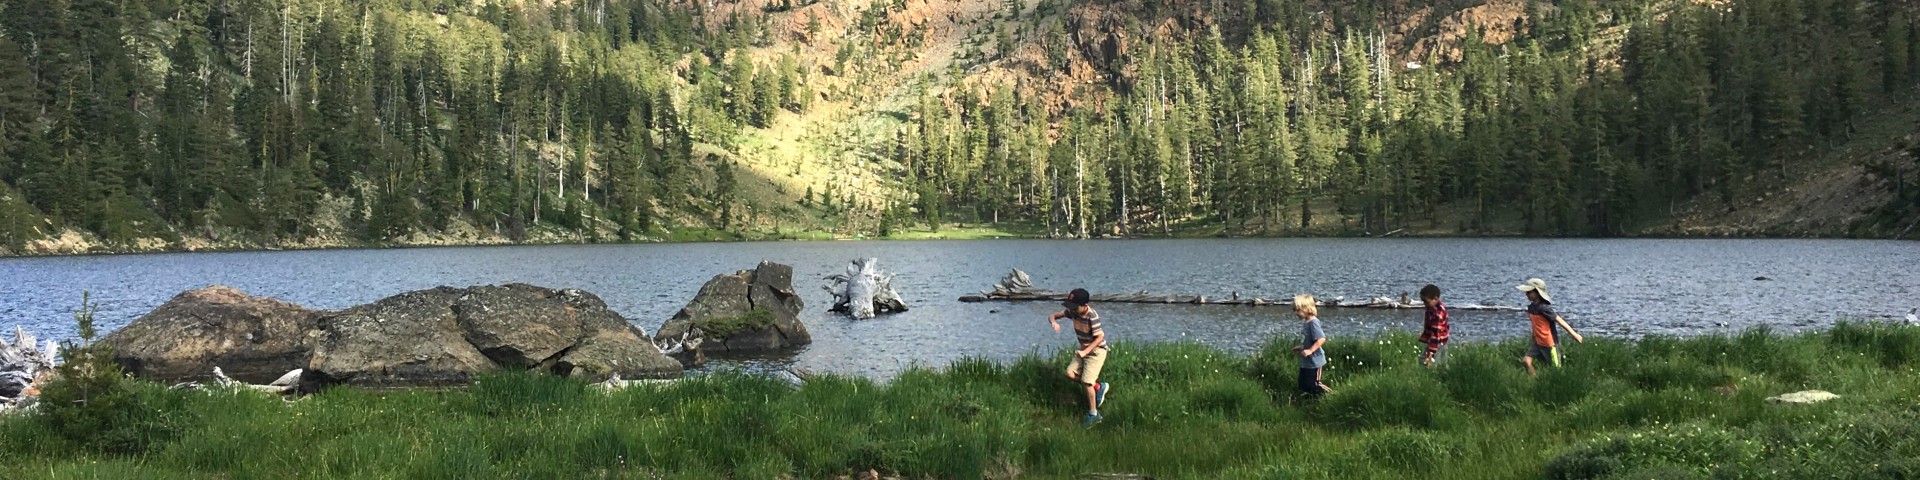
Welcome to the Pacific Southwest!
The Pacific Southwest Region of the US Forest Service manages 20 million acres of National Forest land in California and assists the State and Private forest landowners in California, Hawaii and the U.S. Affiliated Pacific Islands. Eighteen national forests are located in this region, in the North Coast, Cascade, and Sierra Nevada ranges and from Big Sur to the Mexican border in the south Coast range.
Find a Forest
Virtual Services

Visit our FAQ's for answers to many common visitor questions. If you need assistance or have any questions, please use our contact us form. Versión en Español: Visite Preguntas Frecuentes del visitante. Si necesita atención, por favor use nuestro formulario de contacto (inglés únicamente).
Featured Programs
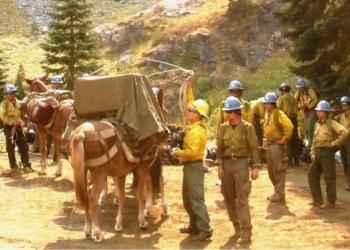
Region 5 employees work on a wide variety of innovative programs such as these, below.
Wildfire Risk Reduction
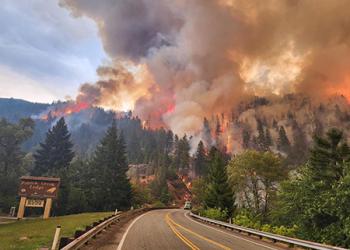
USDA Forest Service works collaboratively to address wildfire risks to critical infrastructure, protect communities, and make forests more resilient.


