

Welcome to Alaska's National Forests
The Alaska Region is home to two of the nation’s largest national forests, the Chugach and Tongass, traditional homelands of Alaska Native peoples. The Alaska Region offers amazing diversity and a multitude of uses.
(We're transitioning to a new web platform to better serve the public. With many pages and links to update, some content may take longer to appear. We appreciate your patience as we work to make it easier than ever to access information and explore your national forests - both online and on the ground.)
Find a Forest
Alaska's Forests
Chugach National Forest
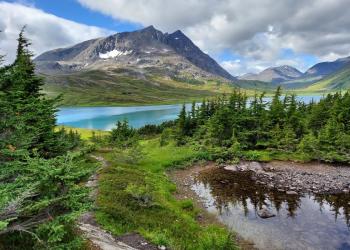
A breathtaking landscape in the heart of southcentral. The Chugach is the backyard for over half of Alaskan's and a coveted destination for hundreds of thousands of visitors each year.
Tongass National Forest

The nation's largest national forest covers most of southeast. The Tongass offers opportunities to view eagles, bears, spawning salmon, and breath-taking vistas of wild Alaska.
Serving the Forest Service Mission
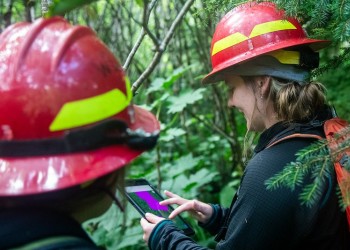
Alaska Forest Health
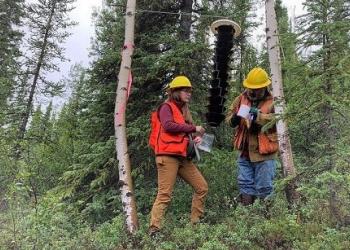
Diseases, insects, disorders, and invasive plants impact forest health. Find reports, identification guides, and more resources for stewarding Alaska's forests.
Smokey Bear Turns 80!
Smokey Bear has been teaching about wildfire prevention for 80 years. Learn more about Smokey, forest health and your role in responsible recreation.
Caring for the Land and Serving People
The Forest Service mission is to achieve quality land management under the sustainable multiple-use management concept to meet the diverse needs of people.
