Monitoring Forest Health with Remote Sensing Tools

Remote Sensing in Alaska

Alaska Forest Health Protection collaborates with partners to develop satellite-based remote sensing methods to detect change & monitor forest health.

What is Remote Sensing?

Remote sensing is any method that scans the earth from a remote position, such as satellite or high-flying aircraft, to obtain information about it. Alaska Region Forest Health Protection (FHP) has been collaborating with others to develop the satellite-based remote sensing methods and tools described below, and make them accessible for detecting change and monitoring the health of our forests. This is in addition to our aerial detection survey (ADS) program, which maps active forest damage from insects, diseases, animals, and environmental causes.

Featured Product: Change Detection Map

Satellite-Based Change Detection Map of Southeast Alaska for the defoliator event 2018-2022.
Satellite-Based Change Detection Map of Southeast Alaska for the defoliator event 2018-2022. The map was created using the Landscape Change Monitoring System (LCMS) and LandTrendr-detected change magnitudes. Learn more about these methods below. View & interact with the map here.

Satellite-Based Change Detection in Alaska

The remote sensing data collected from satellites is used together with our aerial detection and ground surveys to monitor forest conditions. Use of satellite data allows us to increase the area we monitor, which is especially important because Alaska has approximately 126 million acres of forest. Aerial and ground inspections allow us to identify the tree species and cause of damage, because our own eyes are much better at identification. Nevertheless, we cannot reach every acre in person. By using these complementary methods together, we expand our ability to understand forest conditions, and we learn more about the capabilities of monitoring tools being implemented.

Satellite imagery ranges in resolution (pixel size), extent (the area covered by one image), and frequency (how often new images are captured). We use imagery from Landsat, and Sentinel-2, and also high-resolution imagery from various sources. Resolution differences affect the types of change that can be detected and the size of the data. Landsat imagery is available from 1984 to present, monthly to weekly, with good quality data for Alaska starting in 1999. Sentinel-2 imagery is available weekly since 2015. To learn more about how satellite imagery is used by Alaska region FHP, see the information and embedded links below.

Examples of various satellite image resolutions.
Satellite images with different resolutions (a) Landsat with 30 m pixels, (b) Sentinel-2 with 20 m pixels, and (c) WorldView  high-resolution imagery with 50 cm pixels. Color changes are visible in coarse imagery, but individual trees and damage types are not.


Satellite-Based Remote Sensing in Alaska” on page 11 (pdf page 21) of the 2019 Conditions Report. This essay outlines early plans and successes at adapting satellite-based remote sensing methods for FHP use in Alaska.

Integration of Satellite-Based Remote Sensing for Forest Health Monitoring in Alaska” on page 21 (pdf page 31) of the 2022 Conditions Report. This essay explains and compares methods and data from satellite-based change detection and aerial detection surveys in Alaska.

Cover of the 2019 Alaska Forest Health Conditions Report

Alaska FHP created a publicly available map: Satellite-Based Change Detection Southeast Alaska, to show persistent change associated with five years of defoliation from hemlock sawfly and western blackheaded budworm, 2018 to 2022. This extensive defoliator outbreak is known to have caused some tree topkill and mortality. By combining results from the Landscape Change Monitoring System (LCMS) with magnitude change detected by LandTrendr, we created a color severity map showing high, medium, and low change. Forest Health Protection personnel used aerial detection surveys and ground verification where possible, to determine that most of the satellite-detected change in this map is associated with defoliator activity via. Blowdown trees, landslides, and harvest may show in this map as well, although such stands were removed where recent harvest was documented in USFS records.

Comparing photos with satellite imagery based interpretation of defoliation damage on Admiralty Is;
One of the areas most severely defoliated by hemlock sawfly is the forested peninsula north of Chaik Bay on Admiralty Island, Alaska (a). The Satellite-Based Change Detection Map (b) clearly shows change for the peninsula. A close-up photo (c) reveals the gray patches to be trees without needles that may have died or have dead tops. Photos from 2023 Aerial Detection Survey, by Dr. Karen Hutten.

A new remote sensing tool called BugNet has been developed through collaborative work with the EMapR lab at Oregon State University and the Washington State DNR. This tool isolates change caused by forest insect and disease agents by removing fire and harvest detection and highlighting areas most similar to those observed during aerial detection surveys. The tool was developed for use in Washington and Oregon (USDA-Forest Service Region 6) and will be extended into Alaska Region in the coming years.
 

Forest health staff evaluate damage on the ground detected via remote sensing.
Dr. Robert Kennedy (Oregon State University) and Dr. Garret Meigs (Washington DNR)
view the forest from an overlook to compare with Landsat-based change-detection maps,
August 16, 2022. USDA Forest Service photo by Dr. Karen Hutten.

Alaska FHP has collaborated with the U.S. Forest Service Geospatial Technology and Applications Center (GTAC) to test a two-date Sentinel-2 change detection tool called DeltaViewer and assess its ability to detect damage from specific agents. We also tested approaches for obtaining ground verification. So far, DeltaViewer has proven effective at detecting conifer and alder defoliation and spruce beetle damage. It appeared to be more sensitive at detecting light damage from blackheaded budworm than early August aerial detection surveys, and perhaps less sensitive at detecting light alder and spruce beetle damage.

Forest change detected with Sentinel-2 imagery is depicted in yellow, orange, and red, based on the
Forest change detected with DeltaViewer using Sentinel-2 imagery is depicted in yellow, orange, and red, based on the magnitude of change. Whereas red represents the highest magnitude change, it does not necessarily translate to severe or lasting impacts to forest trees; rather, the change there is high relative to that in other areas. The change locations identified with DeltaViewer compare well with data collected during the aerial detection survey (blue polygons). The image on the right was taken during the aerial detection survey and shows browning trees, an area with low to medium change detected in the map on the left (inside black hatched box).


In 2020, aerial surveys were not conducted in Alaska due to pandemic risks. Instead, FHP obtained high-resolution (50 cm) WorldView satellite imagery from MAXAR for a limited number of areas in Alaska from the 2020 summer season. The size of the area ranged from about 1,000 to 10,000 square km. Using a method called Scan-and-Sketch, FHP surveyors viewed this imagery on their aerial survey tablets, drew polygons around unhealthy forest, and attempted to determine the causal agent, host, and severity of damage, similar to conducting aerial detection surveys from the standard low-flying aircraft. Nevertheless, Scan-and-Sketch was found to be an inefficient and tedious replacement for aerial detection survey (Hanavan et al., 2022). Surveyors took more time to accurately place detailed polygons around affected forest and only had access to a few images because high-resolution imagery is not captured everywhere in Alaska each year. Identifying tree species and damage was also difficult compared to what can be seen from aircraft. Even so, high-resolution imagery continues to be useful for viewing forest characteristics and conditions when ground visitation or use of aircraft is not possible. The relative detail makes it a nice supplement to Landsat or Sentinel-2 and helps with tree damage identification.


Aerial imagery used to survey Alaska in 2020 in place of aerial survey.
The areas in Alaska for which high-resolution satellite imagery was obtained and surveyed for a forest damage in 2020. Aerial imagery increases from statewide (top), to northern Prince of Wales and Etolin Islands (bottom left), to a specific surveyed stand (bottom right).

As we learn from different methods and approaches, we improve our methods and available tools for the next year. Change detection processes that were tested this past year will be streamlined and used to create timely maps for forest managers in 2024. A new Survey123 app will allow FHP personnel to easily collect ground data for areas detected as change by satellite.

One of the strengths of satellite imagery is that new advanced methods can be used to quantify changes which occurred in the past, provided cloud-free imagery exists for that date. Analyses can be repeated as methods improve, and all of Alaska is covered annually, or better by some sources.

Some of the disadvantages are that satellites orbit above the clouds, requiring clear skies for a good image. Resolution and frequency of imagery can also be challenging. A detailed image generally covers less area and is data heavy, whereas a large image may cover a lot of area with less detail, making it unlikely to detect small or subtle changes. Also, trees with insect and disease damage vary widely in color, timing, severity, and visibility, potentially requiring different settings to detect different damages. It takes time to develop new methods, but Forest Health Protection will continue to add useful remote sensing tools as fast as we can test them.

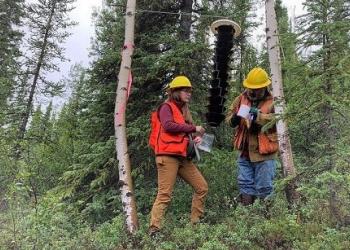
Two surveyors ground-truth remotely-sensed damage with binoculars.
Two surveyors ground-truth remotely-sensed damage near Skagway with binoculars.
USDA Forest Service photo by Dr. Elizabeth Graham.

Additional links and resources coming soon.


Content prepared by Dr. Karen Hutten, Remote Sensing Program Lead, Forest Health Protection, karen.hutten@usda.gov.

Contact us    Forest Health Protection Homepage