northern red oak (Quercus rubra)
Model Reliability: Medium
Available Niche Space Predictor values plotted to climate, soil, and productivity. The niche space of Forest Inventory & Analysis’ (FIA) eastern US range as well as the Little's range of the species are mapped. You can compare the niche space with the corresponding importance value map.
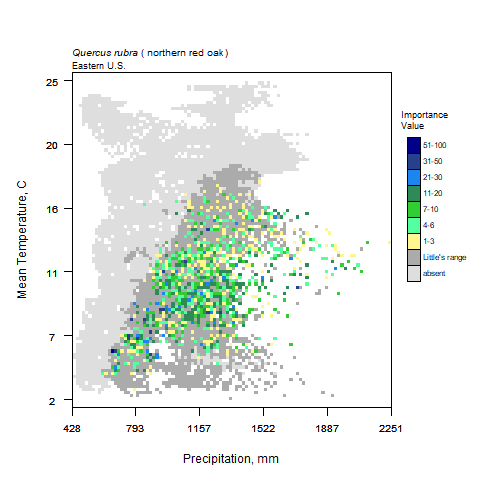
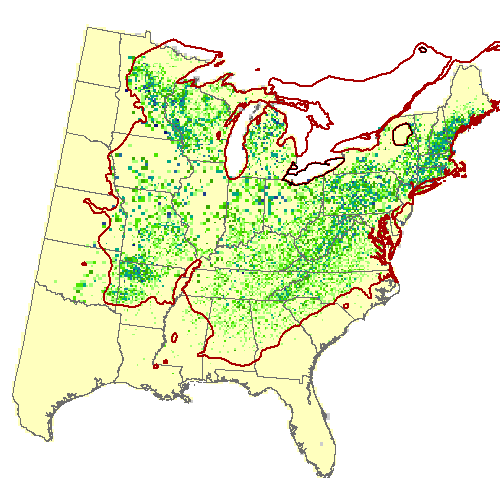
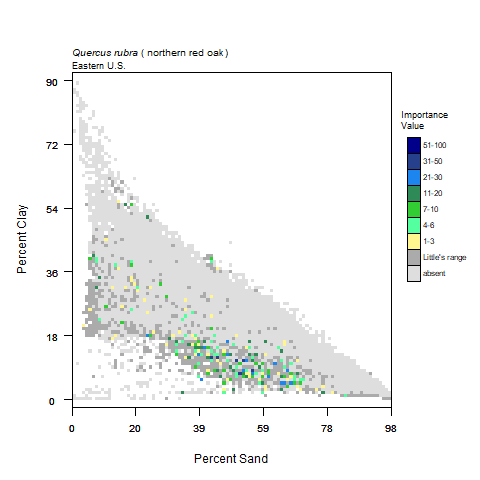
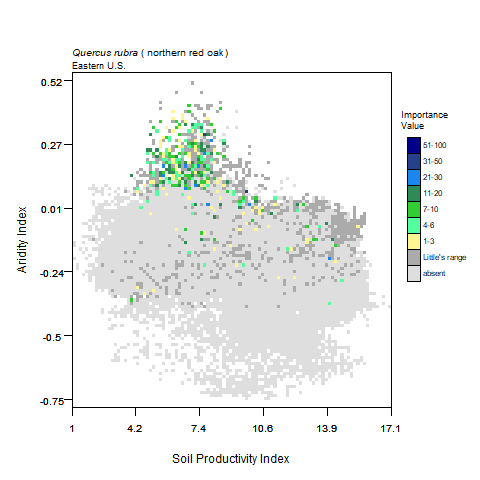
The light gray area expresses the range of the environmental variables portrayed on the x and y axis within the study area. The dark gray regions are based on Little's boundaries and show where the tree species range occupies the environmental conditions. The color regions are specific to the study area and show how the species’ FIA data are distributed across the two-dimensional environmental space. We show the niche space map and the current distribution map, with a similar color scheme, so that viewers can see the relationships between ecological niche space and the geographic space.