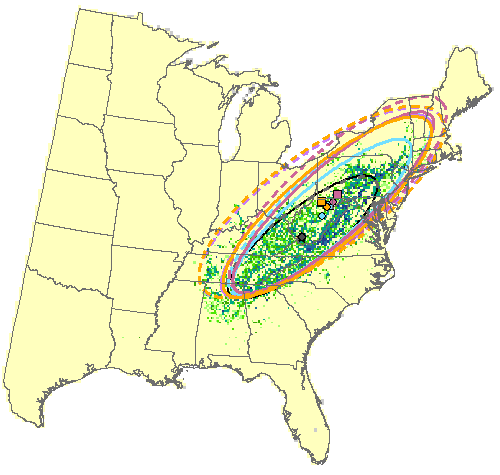
Potential Changes in Mean Center of Distribution for chestnut oak
Model Reliability: High
The maps shows the central location of the distribution based on Hadley, Community Climate System Model 4.0 (CCSM4), Geophysical Fluid Dynamics Laboratory (GFDL), and the average of three GCMs, under Current Conditions, Moderate emissions (RCP 4.5), and High emissions (RCP 8.5).