
The regression-tree diagram along with the corresponding class-map shows what predictors are driving the distribution for this species.

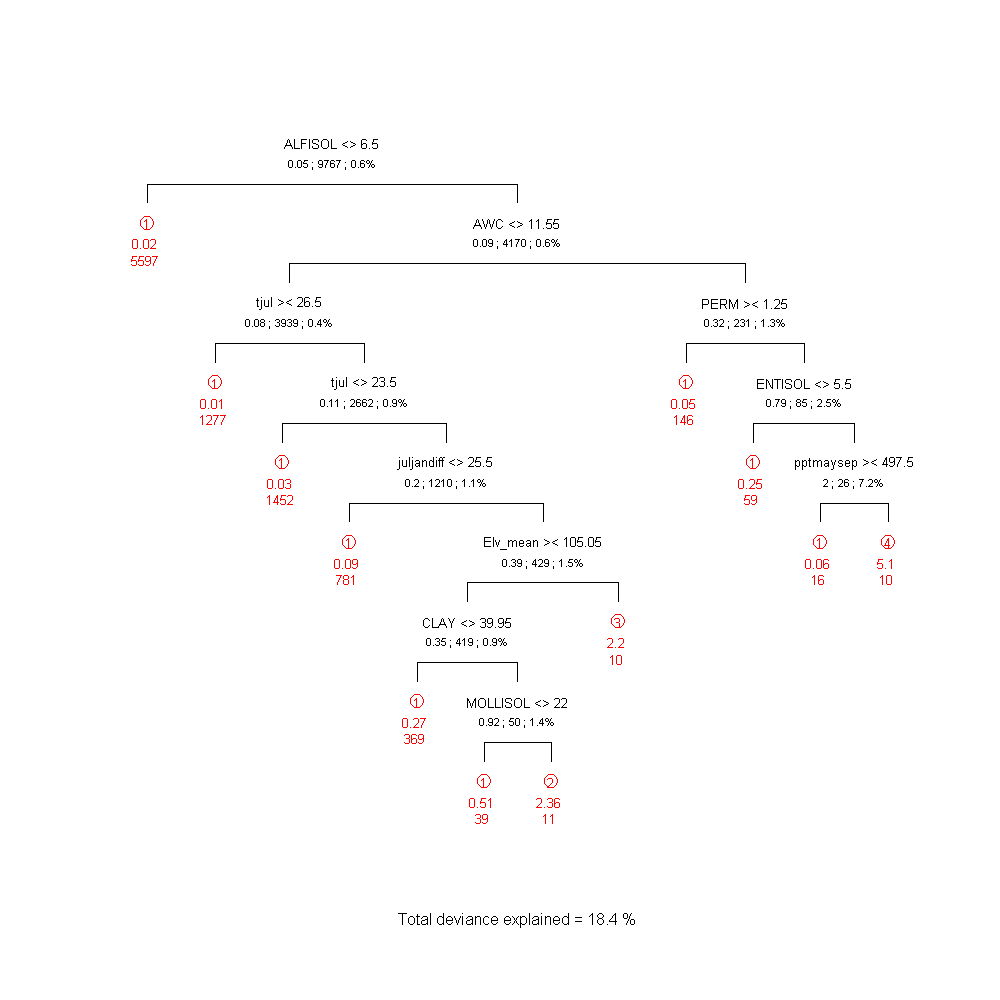
The Geographic Predictors Maps are derived from Regression Tree Analysis, where each terminal node of the 'tree' corresponds to a legend and map color that is represented on the map. As such, one can determine what variables may be driving the species' distribution and abundance at a particular part of its range. For example, a precipitation variable may determine the western boundary and a temperature variable may determine the northern boundary for a species. Also note that variables important high in the tree diagram relate to larger portions of the species' range, while those variables lower (closer to the terminal nodes) relate to more localized variables driving the distribution.
IMPORTANT: It is important to note that if the model reliability is NOT high for the species, then the confidence that the predictors in a single regression tree are driving the distribution is LOW. It is therefore worthwhile to compare the predictor importance according to the RandomForest model also. In the species page, click the "Statistics, Tables & Interpretations" button in the "Current Distriubtion" panel for viewing the predictor importance table under RandomForest model.
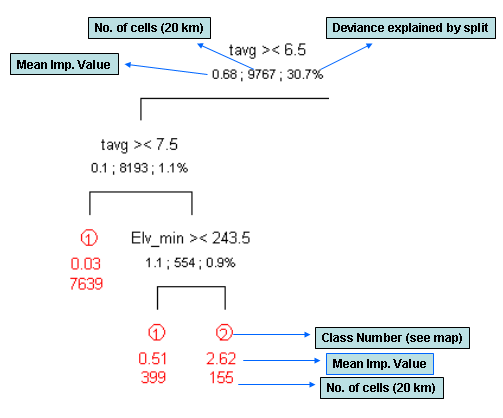
NOTE: Example: If tavg >< 6.5 means that if tavg > 6.5 deg C, traverse the left branch and if tavg < 6.5 deg C traverse the right branch.
If tavg <> 6.5 means that if tavg is less than 6.5, traverse the left branch. and if tavg > 6.5 traverse the right branch.
| Acryonm | Predictor | Group |
|---|---|---|
| PH | Soil pH | Soil Characteristics |
| PPT | Annual precipitation (mm) | Climate |
| TAVG | Mean annual temperature (°C) | Climate |
| TJAN | Mean January temperature (°C) | Climate |
| TJUL | Mean July temperature (°C) | Climate |
| TMAYSEP | Mean May-September temperature (°C) | Climate |
| SPODOSOL | Spodosol (%) | Soil Type |
| ELV_MIN | Minimum elevation (m) | Elevation |
| ELV_MAX | Maximum elevation (m) | Elevation |
| ELV_RANG | Range of elevation (m) | Elevation |
| ELV_MEAN | Average elevation (m) | Elevation |
| ELV_CV | Elevation coefficient of variation | Elevation |
| ALFISOL | Alfisol (%) | Soil Type |
| ARIDISOL | Aridisol (%) | Soil Type |
| ENTISOL | Entisol (%) | Soil Type |
| HISTOSOL | Histosol (%) | Soil Type |
| INCEPTIS | Inceptisol (%) | Soil Type |
| KFFACT | Soil erodibility factor, rock fragment free | Soil Characteristics |
| SLOPE | Soil slope (%) of a soil component | Soil Characteristics |
| ULTISOL | Ultisol (%) | Soil Type |
| VERITSOL | Vertisol (%) | Soil Type |
| WATER | Water (%) | Land-Cover |
| AWC | Total available water capacity (cm, to 152 cm) | Soil Characteristics |
| BD | Soil bulk density (g/cm3) | Soil Characteristics |
| CLAY | Percent clay (< 0.002 mm size) | Soil Characteristics |
| JULJANDIFF | Mean difference between July and January Temperature (°C) | Climate |
| MOLLISOL | Mollisol (%) | Soil Type |
| NO10 | Percent soil passing sieve No. 10 (coarse) | Soil Characteristics |
| NONFOR | Nonforest land (%) | Land-Cover |
| OM | Organic matter content (% by weight) | Soil Characteristics |
| ORD | Potential soil productivity (m3 of timber/ha) | Soil Characteristics |
| PERM | Soil permeability rate (cm/hr) | Soil Characteristics |
| PPTMAYSEP | Mean May-September precipitation (mm) | Climate |
| ROCKDEP | Depth to bedrock (cm) | Soil Characteristics |
| FRAG | Fragmentation Index (Riitters et al. 2002) | Land-Cover |
| FOREST | Forest land (%) | Land-Cover |
| AGRICULT | Cropland (%) | Land-Cover |