Current FIA versus HadleyCM3 – A1FI (High, “Harsh”) for eastern redcedarModel Reliability: Medium 
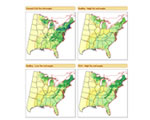
This tool allows you to compare two climate models side-by-side. Select a scenario to display as the "Left Image" using the menu, and a scenario to display as the "Right Image."
 Click and drag the green handle over the maps to compare. You can also click the scenario label below the images to only dispels that scenario map image.
To view more than two maps at one time, use the Multiple Maps option
Percent Area Occupied simply is the percent of 20x20 km cells within the total area of the eastern United States that have been modeled to be suitable for the species. There are a total of 9767 cells used in the model.
Ave. IV is the average importance value across all 20x20 km cells that have been modeled to be suitable for the species.
Sum IV is the sum of importance values across all cells. Thus it is a metric that considers both the abundance and the range of the species, perhaps the best metric of overall species importance.
Future/Current IV is the ratio of change between the modeled current Sum IV and any of the GCM scenarios Sum IV.
Potential Changes in Abundance and Range (Future) |
|||||||||
|---|---|---|---|---|---|---|---|---|---|
| GCM SCENARIO | % Area Occ | Ave IV | Sum IV | Future/Current IV | |||||
| Actual FIA | 23.5 | 5.5 | 12,531 | NA | |||||
| Modelled Current | 49 | 2.8 | 13,509 | NA | |||||
| GCM3Avg-Lo | 78.7 | 3.1 | 23,685 | 1.75 | |||||
| GCM3Avg-Hi | 85.5 | 3.5 | 29,048 | 2.15 | |||||
| PCM-Lo | 72.4 | 2.8 | 20,008 | 1.48 | |||||
| PCM-Hi | 82.1 | 3.4 | 26,875 | 1.99 | |||||
| GFDL-Lo | 80 | 3.3 | 25,720 | 1.9 | |||||
| GFDL-Hi | 88.6 | 3.9 | 33,982 | 2.52 | |||||
| Hadley-Lo | 81.7 | 3.2 | 25,161 | 1.86 | |||||
| Hadley-Hi | 85.9 | 3.3 | 27,693 | 2.05 | |||||