

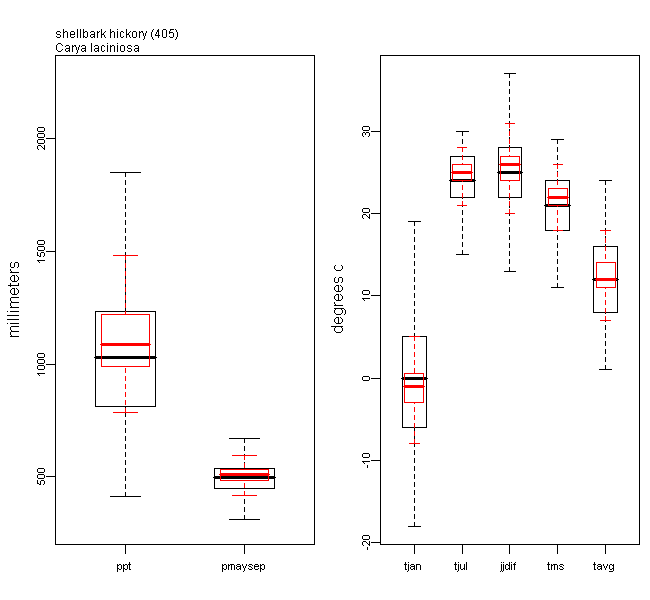
| PPT | Annual precipitation (mm) |
|---|---|
| PPTMAYSEP | Mean May-September precipitation (mm) |
| JULJANDIFF | Mean difference between July and January Temperature (°C) |
| TAVG | Mean annual temperature (°C) |
| TJAN | Mean January temperature (°C) |
| TJUL | Mean July temperature (°C) |
| TMAYSEP | Mean May-September temperature (°C) |
The embedded boxplot (red) is the predictor distribution for the current species and the enclosing boxplot (black) is the predictor distribution of all the 134 species. The predictors are grouped by climate, soil, elevation and landscape.
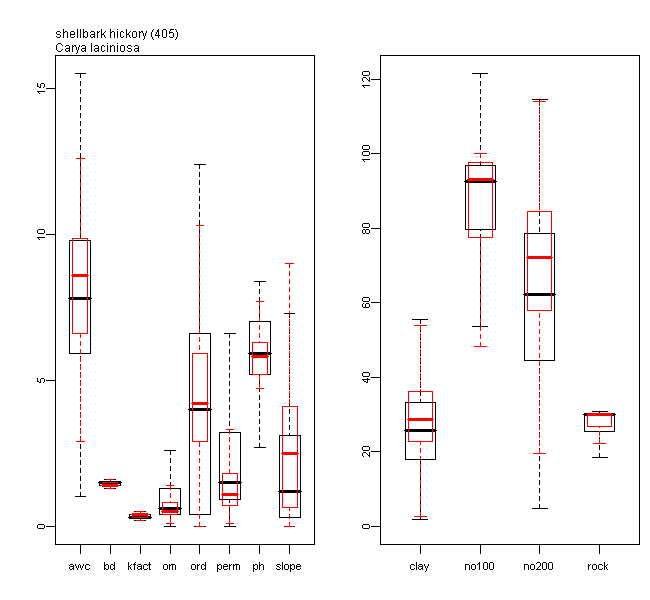
| AWC | Total available water capacity (cm, to 152 cm) |
|---|---|
| BD | Soil bulk density (g/cm3) |
| CLAY | Percent clay (< 0.002 mm size) |
| KFFACT | Soil erodibility factor, rock fragment free |
| NO10 | Percent soil passing sieve No. 10 (coarse) |
| NO200 | Percent soil passing sieve No. 200 (fine) |
| OM | Organic matter content (% by weight) |
| ORD | Potential soil productivity (m3 of timber/ha) |
| PERM | Soil permeability rate (cm/hr) |
| PH | Soil pH |
| ROCKDEP | Depth to bedrock (cm) |
| SLOPE | Soil slope (%) of a soil component |
The embedded boxplot (red) is the predictor distribution for the current species and the enclosing boxplot (black) is the predictor distribution of all the 134 species. The predictors are grouped by climate, soil, elevation and landscape.
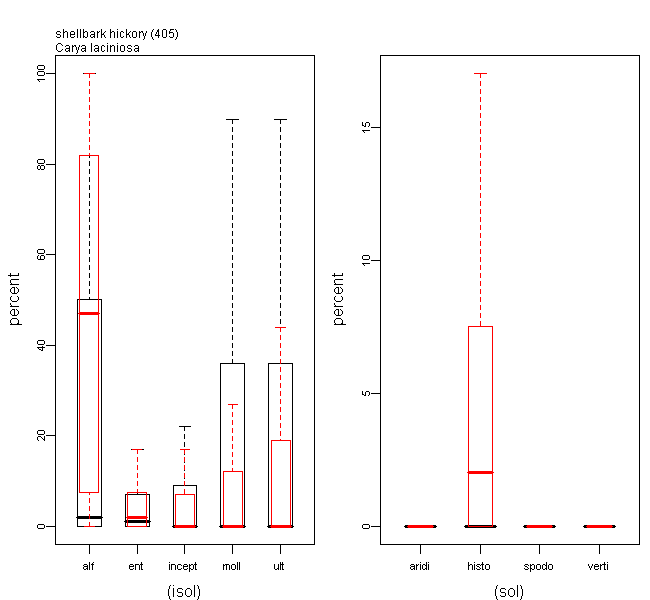
| ALFISOL | Alfisol (%) |
|---|---|
| ARIDISOL | Aridisol (%) |
| ENTISOL | Entisol (%) |
| HISTOSOL | Histosol (%) |
| INCEPTIS | Inceptisol (%) |
| MOLLISOL | Mollisol (%) |
| SPODOSOL | Spodosol (%) |
| ULTISOL | Ultisol (%) |
| VERITSOL | Vertisol (%) |
The embedded boxplot (red) is the predictor distribution for the current species and the enclosing boxplot (black) is the predictor distribution of all the 134 species. The predictors are grouped by climate, soil, elevation and landscape.
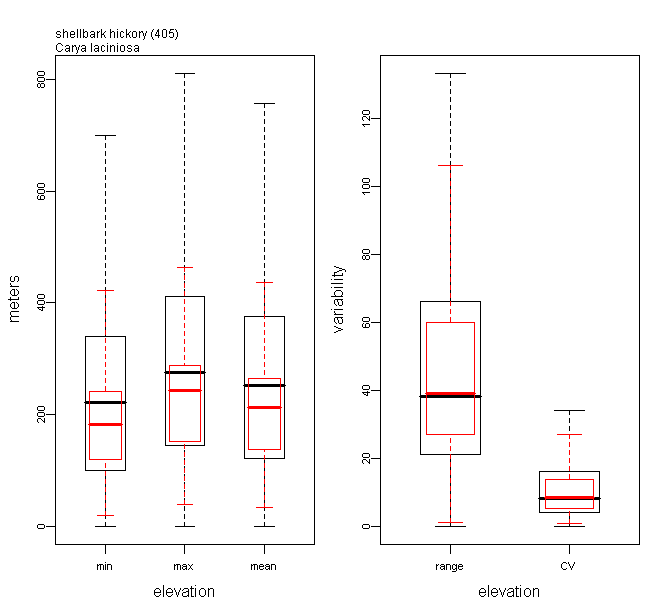
| ELV_CV | Elevation coefficient of variation |
|---|---|
| ELV_MAX | Maximum elevation (m) |
| ELV_MEAN | Average elevation (m) |
| ELV_MIN | Minimum elevation (m) |
| ELV_RANG | Range of elevation (m) |
The embedded boxplot (red) is the predictor distribution for the current species and the enclosing boxplot (black) is the predictor distribution of all the 134 species. The predictors are grouped by climate, soil, elevation and landscape.
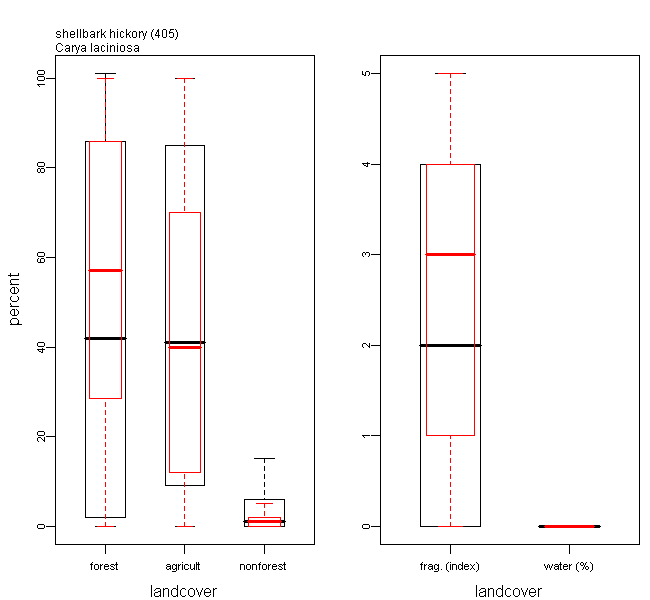
| AGRICULT | Cropland (%) |
|---|---|
| FOREST | Forest land (%) |
| FRAG | Fragmentation Index (Riitters et al. 2002) |
| NONFOR | Nonforest land (%) |
| WATER | Water (%) |
The embedded boxplot (red) is the predictor distribution for the current species and the enclosing boxplot (black) is the predictor distribution of all the 134 species. The predictors are grouped by climate, soil, elevation and landscape.
|