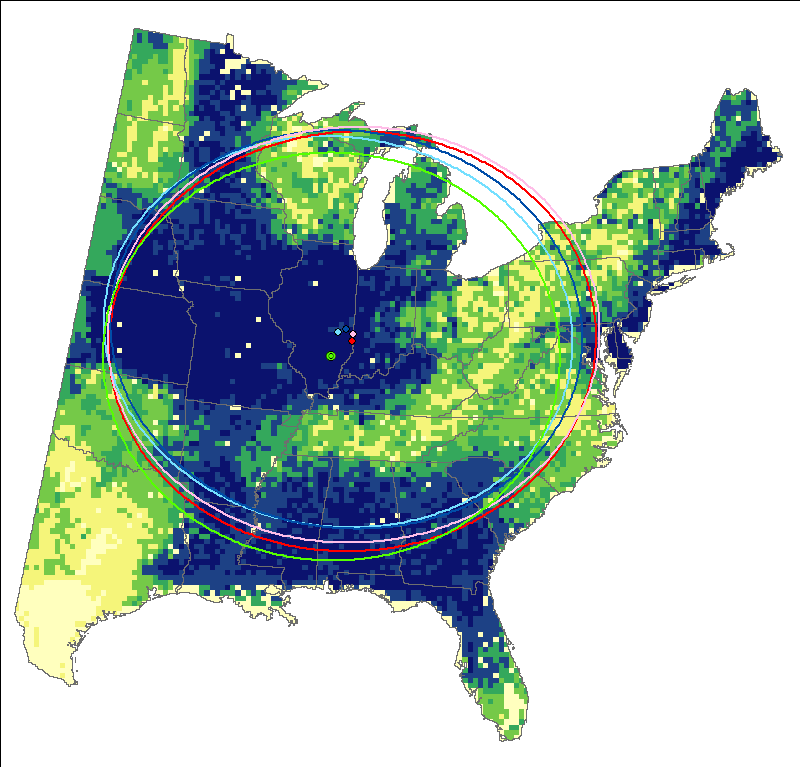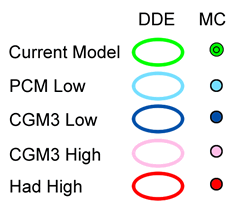
The maps shows the central location of the distribution based on Hadley high (harsh scenario), PCM low (mild scenario), GCM3 low and GCM3 high (average of the three GCM scenarios for low and high carbon emissions).

One standard deviation elipses for four climate scenarios.
