Welcome to Willamette National Forest
Welcome! We've transitioned our public websites to a modern web platform to better serve the public. With thousands of pages to update, some content may take longer to appear. Some old content has been archived during this process, as well.
We appreciate your patience as we work to make it easier than ever to access information and explore your national forests - both online and on the ground. Please send us an email if there is something you can't find:
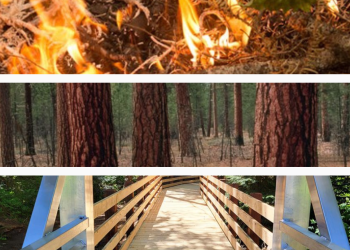
The Willamette National Forest stretches for 110 miles along the western slopes of the Cascade Range in western Oregon. The Forest is 1,675,407 acres in size. The varied landscape of high mountains, narrow canyons, cascading streams, and wooded slopes offer excellent opportunities for visitors and make the Forest valuable for many purposes.
The Willamette National Forest offers a wide variety of recreation opportunities. Its central location makes it accessible to day-trippers and vacationers alike. The forest has developed c
2025 Central Cascades Wilderness Trip Planning

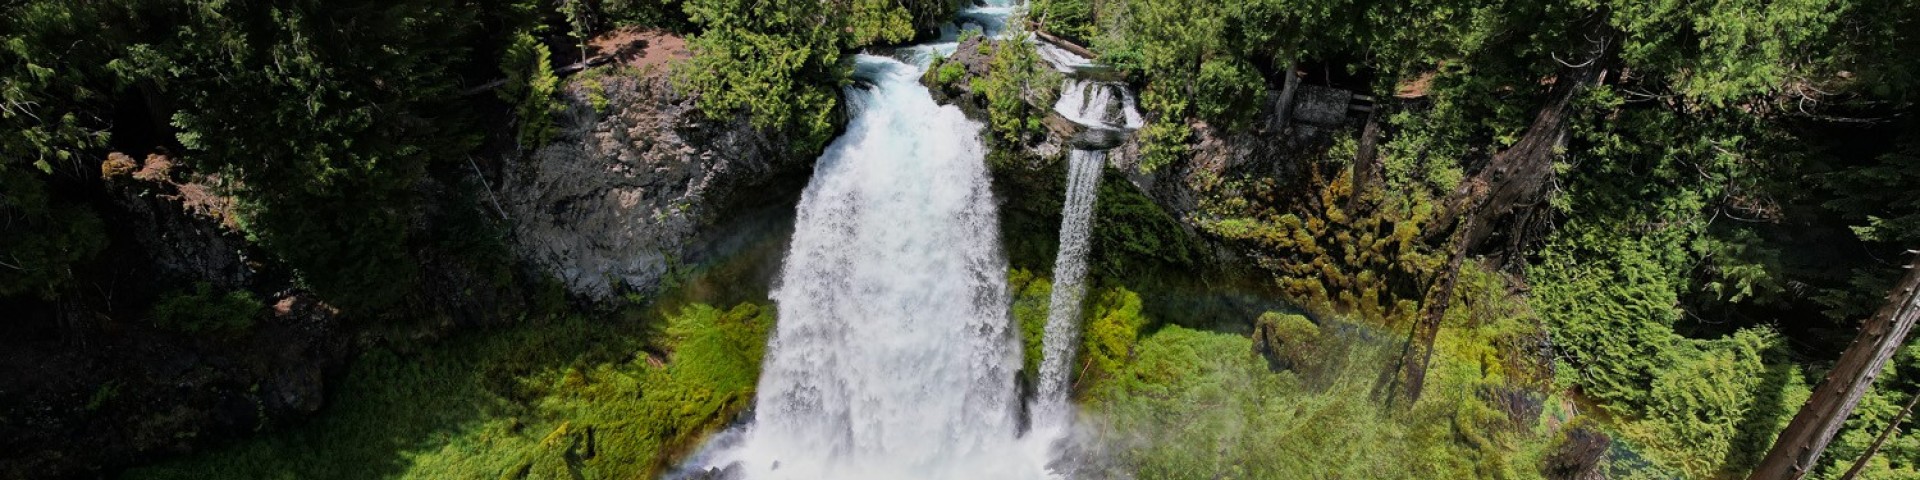
The Central Cascades wilderness areas of Oregon are home to iconic mountain peaks, high alpine meadows and lakes, and old growth forests. In an effort to preserve the natural beauty and wilderness experience for you and future visitors and to better manage recreation-related impacts, these areas will be managed with use limits, or quotas, June 15-Oct. 15. to ensure the protection of these landscapes now and into the future.