| FEIS Home Page |
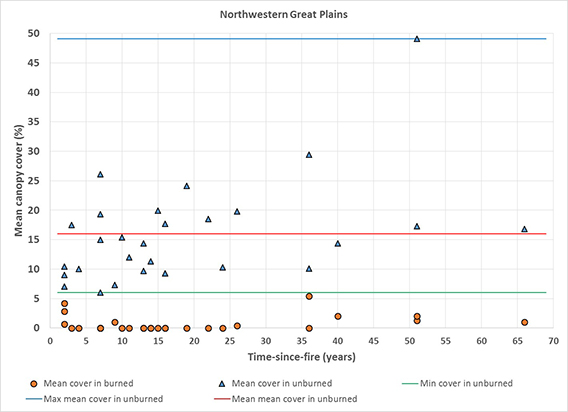
| Column I—Mean canopy cover on burned sites (circles) versus time-since-fire and paired mean canopy cover on unburned sites (triangles) in seven ecoregions. Lines show the minimum, mean, and maximum values of mean canopy cover in unburned sites used to represent full recovery in our analyses. Column II—Ratio of Wyoming big sagebrush canopy cover on burned sites to that on unburned sites (i.e., "postfire recovery") versus time-since-fire in eight ecoregions. The red line shows 100% recovery: Squares above the red line are considered fully recovered, those below are not. | |
| I) Canopy cover over time | II) Recovery over time |
| a) | a) |
 |
 |
| b) | b) |
 |
 |
| c) | c) |
 |
 |
| d) | d) |
 |
 |
| e) | e) |
 |
 |
| f) | f) |
 |
 |
| g) | g) |
 |
 |
| aEcoregions are based on the EPA's Level III ecoregion classifications for the conterminous United States [549]. Data on Wyoming big sagebrush canopy cover and postfire recovery comes from these ecoregions and sources: a) Blue Mountains [452], b) Central Basin and Range [129,716,807], c) Middle Rockies [423,474,567,760,770,775], d) Northern Basin and Range [38,39,43,129,196,234,842], e) Northwestern Great Plains [72,165,229], f) Snake River Plain [46,149], and g) Wyoming Basins [317]. | |